Working experiments
Lab
Try public demos, explore interactive visualizations, and play with the ideas behind the work. Tools that require sign-in are marked.
Interactive
Quant, in three dimensions
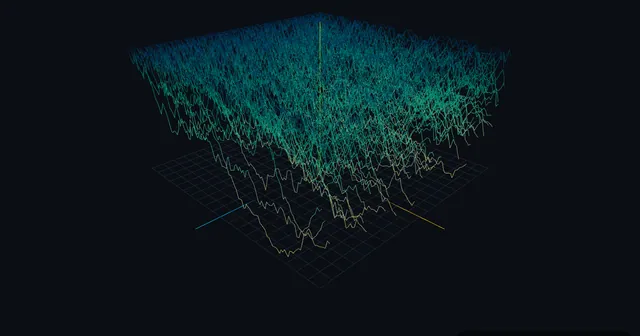
Interactive visualizations of the math behind markets, computed live in your browser. A different instrument takes the frame on every visit. Orbit it, scrub it, or shuffle to another.
Try a demo 6
Public demos and tools. No account needed.
- Grade a portfolioGet an AI review of a fixed sample portfolio, with model-generated grades and commentary.Open
- Watch the agent writeChoose a topic and receive one inline AI draft using fictional or supplied facts.Open
- Chat with a postAsk a blog post questions. It answers only from the text, and shows you where.Open
- Coach meThe coach reads a fixed sample athlete’s training and recovery, then explains a recommendation.Open
- Pokemon Cards vs. the MarketGraded card prices against the S&P 500, the Nasdaq-100 and gold, indexed to 100 on one axis. Cited sales are marked; the estimated stretches say so.Open
- Equations IndexEvery equation running on this platform, entropy to Black-Scholes, typeset by math domain and linked to the page or engine where it works.Open
Interactive visualizations 13
Market math computed live as you drag. The data boundaries are marked, not hidden.
Derivatives 3
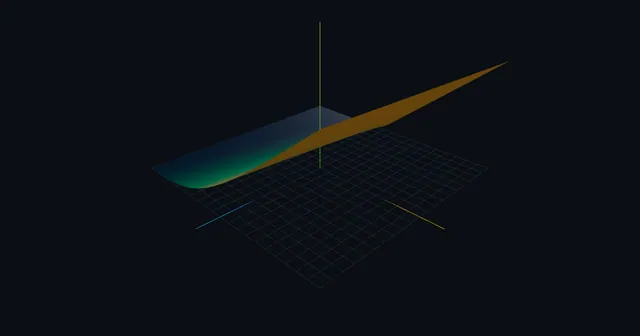 Option Greeks ManifoldA long call's P&L as a 3D surface over spot price and time to expiry. Orbit it, and reshape it by any Greek.
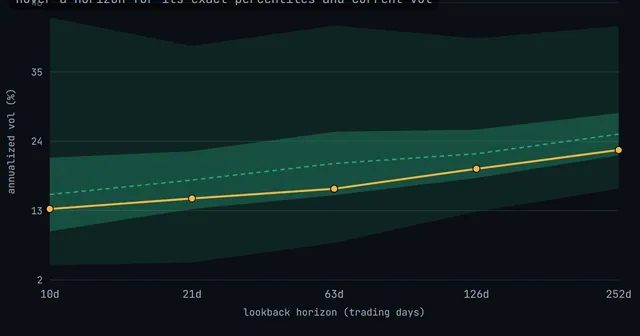 Realized Volatility ConeA stock's realized annualized volatility across lookback horizons {10, 21, 63, 126, 252} days, drawn as percentile bands with today's term structure threaded through the historical envelope. Pick any S&P 500 name; the bands come straight from its baked realized-vol history.
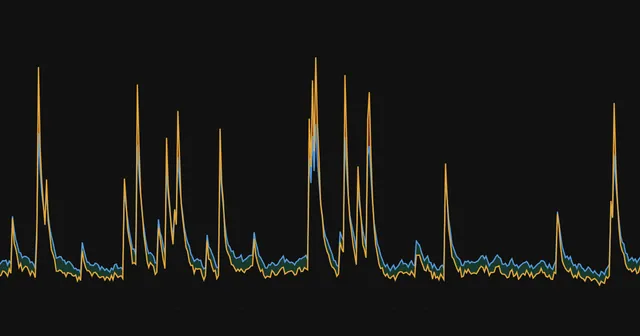 Variance-Risk-Premium StripImplied 30-day SPX vol (VIXCLS) against the SUBSEQUENT 21-day realized SPX vol since 1990, with the premium shaded as the gap: green where implied over-prices the calm that follows, red where the 2008/2020-class crises drive realized above implied. Realized is subsequent, not concurrent, so the premium is a real forward comparison.
Market structure 6
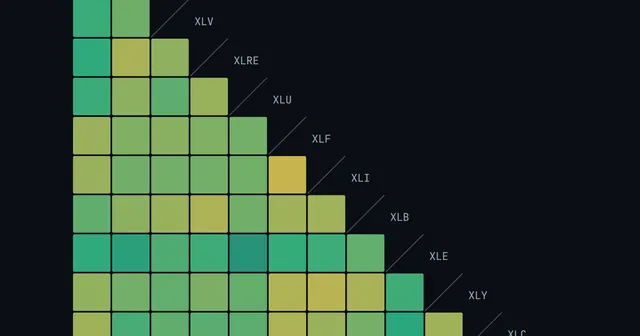
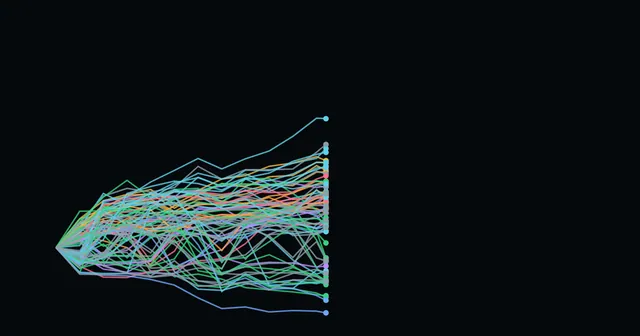 Market APEX BoardA six-lens board over the public ranked universe: race the trading year, map valuation versus momentum, explore any factor pair, see what moves together, scan every factor at once, and read sector rotation.
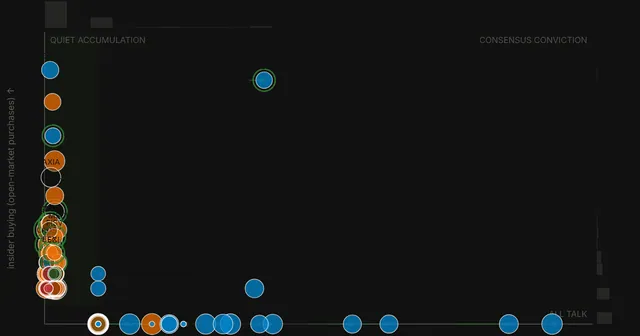 Insiders vs. the CrowdOpen-market insider purchases (SEC Form 4) against Reddit chatter for 550+ names: quiet accumulation, consensus conviction, and all-talk corners, refreshed daily from public data.
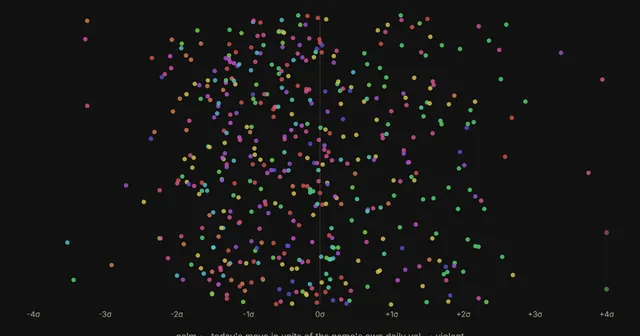 Seismograph BoardA 2D beeswarm of every universe name's one-day move expressed in units of its own daily realized vol (z = move / vol), colored by sector and winsorized at ±4σ. A +2% day means something different for a sleepy utility than for a chip name; the board reads that dispersion at a glance.
 Market ConstellationEvery name on the public board becomes a star in a force-directed galaxy: sectors form the clusters, factor similarity draws the edges. Click a cluster or a single star and jump straight into that symbol's grade and its other visualizations.
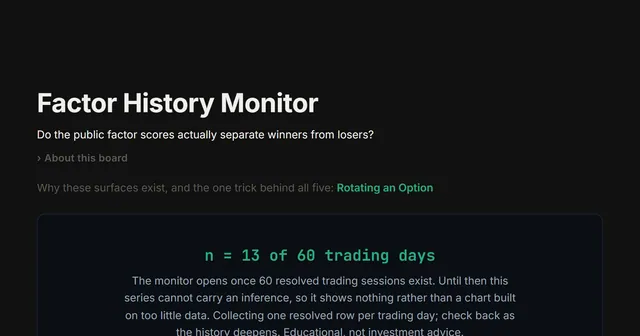 Factor History MonitorPer-factor forward-return quintile spread and rank information coefficient over time, each with an indicative bootstrap band and a printed sample count. Ships dark until 60 resolved trading days exist, because an honest monitor refuses to draw a chart the sample cannot support.
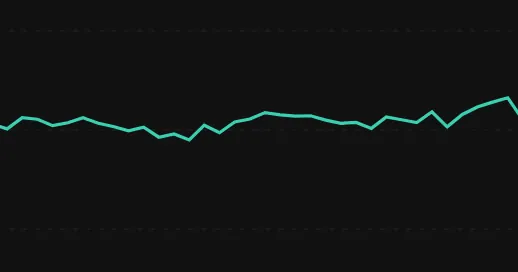 Breadth and Dispersion BoardA board-level read of the whole universe: the percent of names above their 50-day average, the raw advancer and decliner counts each day, and the cross-sectional dispersion of one-month returns. Counts are raw, never indexed; the 90-day data boundary is marked, not hidden.
Macro 2
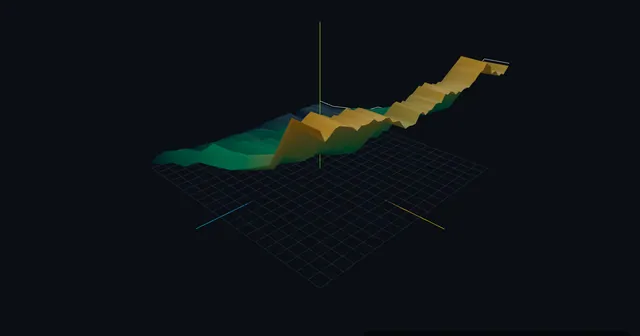 Yield Curve DynamicsA Treasury yield curve as a 3D maturity-by-time surface. Scrub or play the shift from normal to inverted and watch the recession signal form.
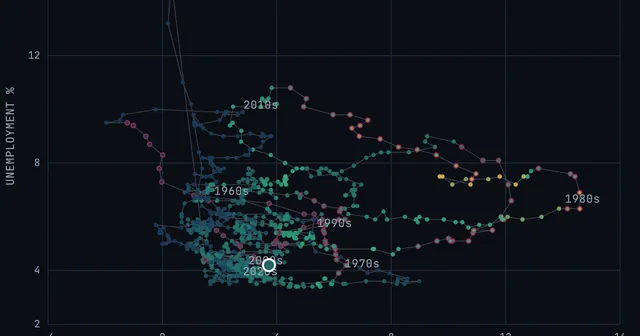 Macro Phase PortraitInflation, unemployment, and the policy rate as a single glowing trajectory from 1960 to today. Scrub the decades and watch the stagflation loops, the Volcker dive, and the COVID spike.
Markets 1
Public market pages from the nightly scan. Real data, no sign-in.
Play 2
Two-minute games built on real price history.
Use with your data 2
Tools that use your data. Sign-in required.
- Investment CommitteeScore any stock across four weighted factors—Quality, Valuation, Momentum, and Health—and read the committee’s written verdict from six investor lenses.Sign in
- Marathon CoachLive Garmin data turned into load, mileage, and heart-rate analytics, with a coach grounded in your own training history.Sign in
Follow the work
New tools and writing as they ship — pick a channel.