How do you read a 3D option Greeks surface?
Read the Greeks manifold's 60 by 60 grid as a long call's profit and loss in height, colored by one Greek: gamma a ridge near the strike sharpening toward expiry, theta the downhill slope toward expiry, delta the slope along price. Vega and rho are different; they recolor the sheet by a sensitivity and, through their sliders, move the premium the height is measured against.
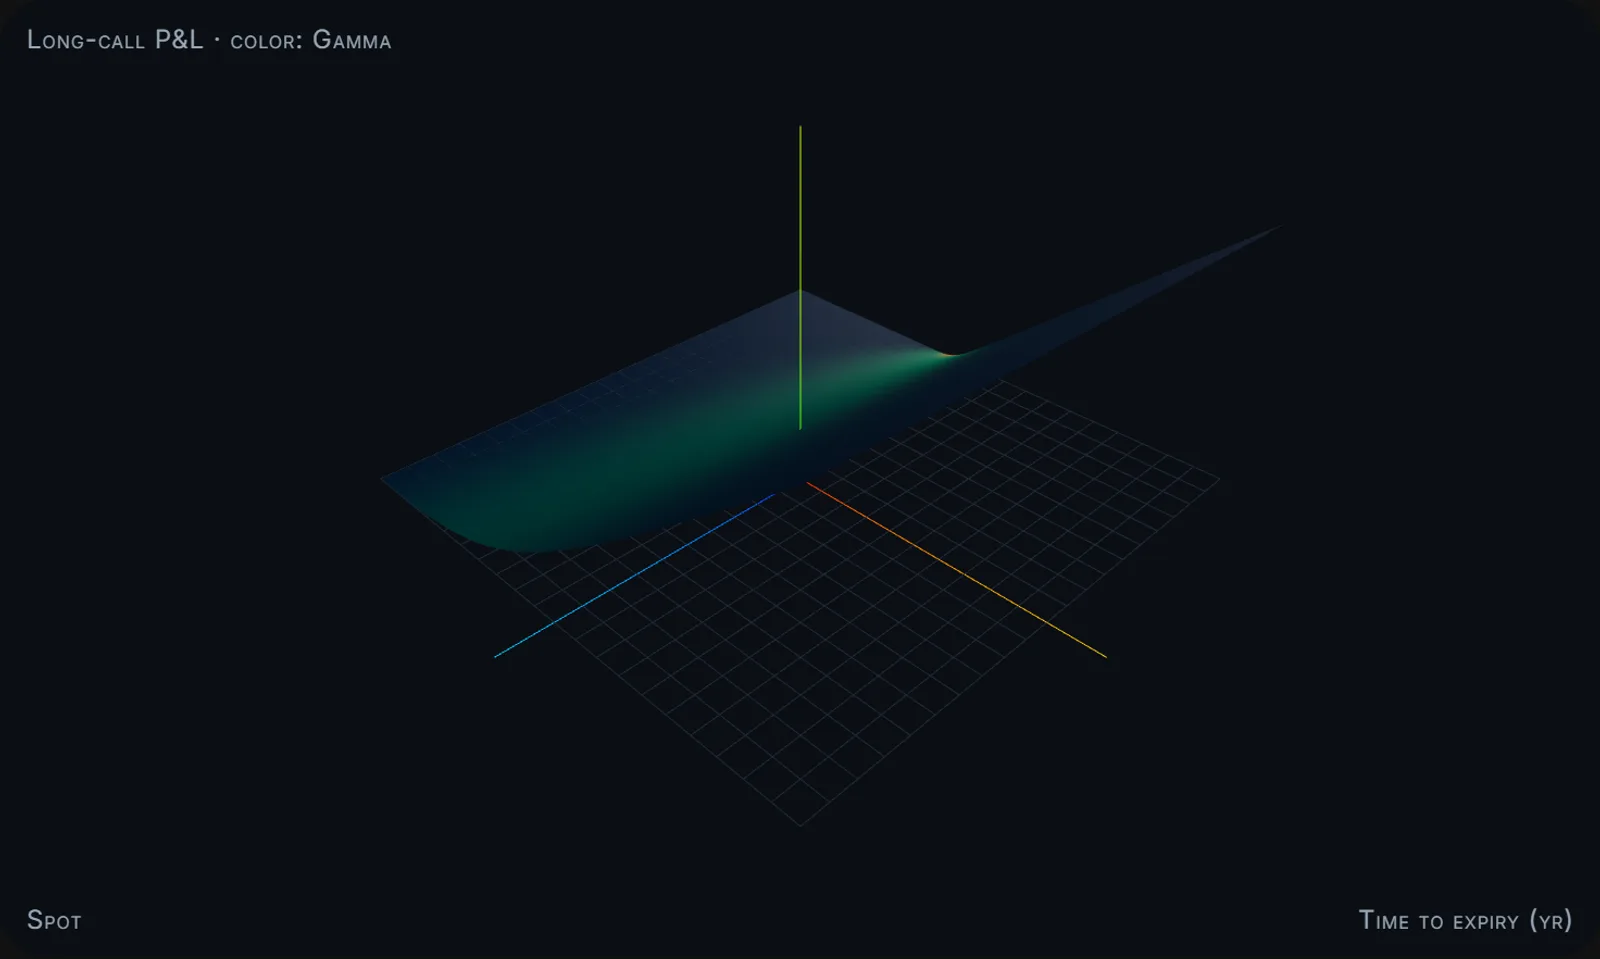
Height is profit and loss against a fixed premium#
The surface has three axes. Spot price runs one way, time to expiry runs the other, and height is the call's value at that point minus a premium fixed once per surface: the at-the-money call value at the longest tenor on the time axis. The single point at the strike and the longest tenor therefore sits at zero, and every other cell shows what the position would be worth relative to what it cost. On the default inputs that is a strike of 100, volatility of 25 percent, a risk-free rate of 5 percent, spot from 40 to 180, and time to expiry from 0.02 to 1.5 years, and each of the five sliders redraws the 3,600-cell grid.
Color is a separate channel. Each cell also carries the five Greeks of the call at that point, and the selector paints the sheet by one of them. The first time I rotated the surface, in the post that built the five 3D views, gamma was just sitting there as a ridge. The sections below map each textbook Greek onto what the sheet does.
Read delta and gamma along price, theta toward expiry#
Delta is the slope of the surface along the price axis. Far below the strike the sheet is flat and delta is near zero; far above it the sheet rises one for one with spot and delta is near one; the transition happens across the strike, gradual on the long-tenor edge and abrupt on the near-expiry edge.
Gamma is the rate at which delta changes with spot, and painting by it lights a ridge across the sheet. The ridge is near the strike, not exactly on it: by the formula the tool uses, gamma at a fixed tenor peaks at a spot of the strike times an exponential in rate, volatility squared and time, which at the default inputs puts the peak near 81 on the 1.5-year edge and within a point of 100 at 0.02 years. Drag the lower end of the time range toward 0.02 years and the ridge slides onto the strike and narrows into a spike: with almost no time left, the call is either worth its intrinsic value or nothing, and all of the bend collapses onto 100.
Theta is the slope of the sheet in the time direction, read toward expiry. Hold spot at the strike and walk from the 1.5-year edge toward the near edge: the sheet falls, and the fall steepens near the end. That is the value the option loses to the calendar, and on the surface it is the direction water would run.
Vega and rho recolor the sheet and move the benchmark#
Vega and rho are not slopes of the sheet, because volatility and rate are sliders rather than axes. Painting by vega colors each cell by how much the call's value there would change with volatility, largest near the strike at long tenors; painting by rho does the same for the rate. Moving either slider does two jobs at once: it reprices every cell, and it reprices the premium benchmark, so the profit-and-loss sheet changes relative to a moving zero rather than simply rising or falling. The point at the strike and the longest tenor stays at zero whatever the sliders say.
Ticker mode positions the surface on a published name#
The synthetic surface teaches the shape. Ticker mode puts a real name under it. Choose a published symbol from the curated set of 30 large caps or the S&P 500 set and the surface re-centers: the stock's spot becomes the strike, its realized volatility from up to 61 closes becomes sigma, clamped to between 5 and 150 percent, the spot axis becomes 0.4 to 1.6 times spot, and up to 90 closes are drawn across the sheet as a path. On the file published 2026-09-24, AAPL carried a spot of 337.02 and a realized volatility of 28.9 percent, so ticker mode puts the ridge near 337 instead of 100 and runs the volatility at 28.9 instead of 25. The spot and volatility are a dated snapshot of public prices, shown to position the surface, not investment advice.
The inputs come from a baked file, not a live call. A scheduled job runs each weekday before the US open, pulls price history from Financial Modeling Prep, computes annualized realized volatility as the sample standard deviation of daily log returns times the square root of 252, drops any series with fewer than 30 closes, and writes one row per symbol. The S&P 500 set only flips to a new version when at least 400 names resolve, so a bad fetch cannot publish a thin universe, and a name that failed to publish is simply absent from the picker. The browser reads the file and never touches the API.
The model prices a European call without dividends#
The pricing is textbook Black-Scholes for a European call with no dividend yield, and the normal distribution is the Abramowitz and Stegun approximation with a maximum error around 1.5 times 10 to the minus 7, well inside the tolerance of the finite-difference checks the Greeks are tested against. There is no put surface and no early exercise. The rate is one slider from 0 to 15 percent, not a term structure. The smile mode, one toggle away, is synthetic and says so on the page, because a real implied-volatility feed is a spend I have not approved: the synthetic smile supplies no market-implied volatility for any strike or expiry.
Related:
- Rendering an options Greeks surface in 3D in the browser, how this and the other four surfaces were built on one math-to-mesh boundary
- Pricing 215 million options a second with SIMD C++, the SIMD C++ pricer whose implied-volatility solver the smile mode's solver mirrors
- How do you know the compiler actually vectorized your loop?, why a build log that said "loop vectorized" was wrong about the loop that mattered
Questions this post answers
- What does the height of the Greeks surface mean?
- Profit and loss on a long call: the Black-Scholes call value at that spot price and time to expiry, minus a premium fixed for the whole surface as the at-the-money call value at the longest tenor on the time axis. The one point at the strike and the longest tenor is therefore zero, and every other cell shows the position's gain or loss relative to what it cost.
- What does gamma look like near expiry?
- A ridge that moves onto the strike and sharpens as time to expiry shrinks. Gamma is the rate at which delta changes with spot. By the formula the tool uses, its maximum at the default inputs sits near a spot of 81 on the 1.5-year edge and within a point of the 100 strike at 0.02 years, so shortening the time range pulls the ridge to the strike and narrows it to a spike.
- Can the Greeks surface use a real stock?
- Yes, for any published name in the curated set of 30 large caps or the S&P 500 set. The stock's spot becomes the strike, its realized volatility from up to 61 closes becomes sigma, clamped to between 5 and 150 percent, the spot axis becomes 0.4 to 1.6 times spot, and up to 90 closes are drawn as a path. The inputs come from a file baked each weekday, never a live API call from the browser.
- Does the tool show implied volatility or real options prices?
- No. The math is textbook Black-Scholes for a European call without dividends, and the smile mode is a labeled synthetic surface, because a real implied-volatility feed is a spend I have not approved. The tool shows how a call's value and Greeks bend across price and time; it does not quote a market.
Keep reading
Rendering an options Greeks surface in 3D in the browser
A 3D render crossed my feed once and stuck with me, so I tried to see an option the same way: as a surface I could grab and turn, not a number. That turned into five market visualizations on one shared trick, a compliance rule the architecture enforces by accident, and an honest lesson about wanting a crystal ball and getting understanding instead.
Pricing 215 million options a second with SIMD C++
I wrote a C++ options pricer to learn low-latency numerics. The first clean version priced fifteen million options a second; getting to 215 million was less about clever code and more about being wrong, in public with myself, about where the speed would come from.
How do you know the compiler actually vectorized your loop?
My build log said the loop was vectorized, and it had: a trivial loop at the end of the benchmark. The pricing loop, the one with exp and log in it, stayed scalar until I wrote the four-wide math by hand and the engine went from about 114 million to about 215 million options a second. Three checks that catch a claimed win, and what the numbers look like when SIMD is real.
Market's Best
The top-graded stocks from the latest market scan. No sign-in needed.
More games
Browse the rest of the games.
Grade my portfolio
Run a sample portfolio through the investor committee.
Follow the work
New tools and writing as they ship — pick a channel.