The Binder and the Benchmark
One of my kids asked me what a Charizard is worth.
Not their Charizard. The Charizard. The 1999 Base Set holo that shows up in every video about cards as investments, usually next to a claim that a binder from 1999 beat the stock market. My kids collect cards the way I once did, for the trades and the pulls, but the question was a real one and it deserved a real answer. So I did what I do with every question about money: I went looking for the data, and I charted it against a benchmark.
The chart is live at caskeycoding.com/lab/pokemon-vs-market. Every series is indexed to 100 at the start of the range, so a playground card and the entire S&P 500 share one honest axis. You can toggle cards, benchmarks, and averages, flip between log and linear scales, and read the exact numbers in a table. Since 2004, a PSA 10 first edition Charizard is up roughly 62x. The S&P 500 is up about 6.6x. That gap is real, and it is also not the whole story.
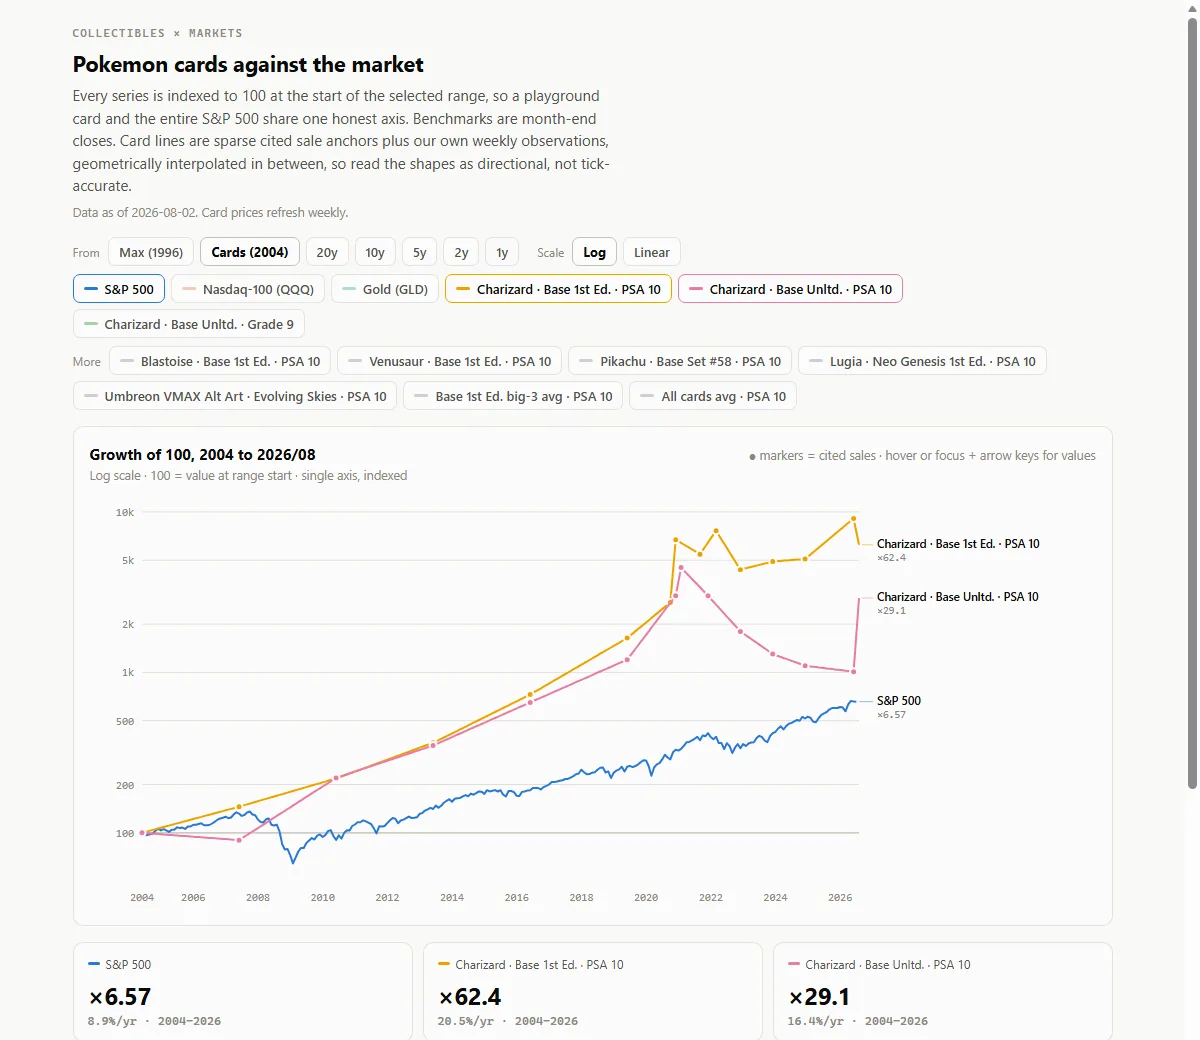
Here is the part the videos skip. There is no clean thirty year price series for a Pokemon card. Nobody was recording card prices in 1999, the deep auction archives sit behind a bot wall, and the sources that do exist mostly cover the last year or two. I had three options: pretend, pay, or admit it. The board admits it. The deep past is a handful of cited record sales, drawn as ringed dots so you can see exactly how sparse they are. The line between them is labeled as an estimate. From this week forward, a scheduled job records real market prices every Sunday, so the board earns a genuine first party history one week at a time. Where the record sale era meets the measured market era, the line visibly jumps, and the page says why instead of smoothing it over.
That choice was not invented for a card chart. I run a personal finance engine as a side project, and the rule I hold it to is the same rule I held this chart to: label what is measured, label what is modeled, and let a missing number stay missing. A gap in a chart is information. A smoothed line over a gap is a small lie that compounds.
The answer I gave my kid, in the end, had numbers in both directions. Yes, the grail card crushed the index, if you had graded the right card, in the right year, and paid the auction fees, and never spilled juice on it. Also: your binder is not the record sale, cards pay no dividends, and the index never needed a protective sleeve. They mostly wanted to know if the binder was cool. It is.
The cards taught my kids how to trade. I built the chart for the quieter lesson: the point is not what the grail sold for. The point is what the data can honestly say. The board records a new observation every Sunday morning, and the answer keeps earning itself, one week at a time.
Keep reading
More games
Browse the rest of the games.
The Aquarium That Became a Trading Floor
A screensaver joke, every stock a fish, grew into a six-lens market board I leave running on a wall. It lives in one HTML file on purpose, its data is baked because the browser is not allowed to fetch it, and the feature that finally made it work on a phone is the URL itself.
The Pocket Quant
I built a quant research platform, then built an agent to operate it: a scheduled Claude session that reads the boards, keeps a pre-registered track record, and texts me three times a day without ever saying buy.
Fifteen Million Was the Easy Part
I wrote a C++ options pricer to learn low-latency numerics. The first clean version priced fifteen million options a second; getting to 215 million was less about clever code and more about being wrong, in public with myself, about where the speed would come from. This is the why, the what, and the how.
Rotating an Option
A 3D render crossed my feed once and stuck with me, so I tried to see an option the same way: as a surface I could grab and turn, not a number. That turned into five market visualizations on one shared trick, a compliance rule the architecture enforces by accident, and an honest lesson about wanting a crystal ball and getting understanding instead.
Ballast: An LLM App Whose Best Feature Is Saying 'I Don't Know'
I built a self-healing RAG pipeline, a guardrails gateway, and an eval gate as one system, then threw 44 adversarial questions at it. Zero hallucinations, because the most important thing it does is refuse. Here is how trust got built into the architecture instead of the prompt, and the safety check that leaked the very thing it was guarding.
Follow the work
New tools and writing as they ship — pick a channel.