Backtesting the 5/10 crossover strategy that never lost
Twenty-four thousand likes for one sentence: the simple 5/10 strategy that has not lost in eight years. No instrument, no average type, no bar interval, and the source video is gone. That vagueness is not a technicality. It is the whole mechanism, because a claim that never commits to a definition can never be wrong. So the first job of this autopsy was to commit on the claim's behalf, as generously as possible, and then let the claim be tested the way it was told: against its own metric.
The steelman#
The charitable reading matters more than the takedown. I have no reason to think the original poster acted in bad faith, and the account is not the subject here; the claim is. So the codification logs three interpretations and marks the most charitable retail reading as the headline: a 5/10 simple moving average crossover on daily SPY bars. The other two readings, weekly SMA and daily EMA, ride along so nobody can say the test picked the weakest version. Every choice is recorded in the claim's codification file, and the uncertainty about what the poster meant is logged as data, not smoothed over.
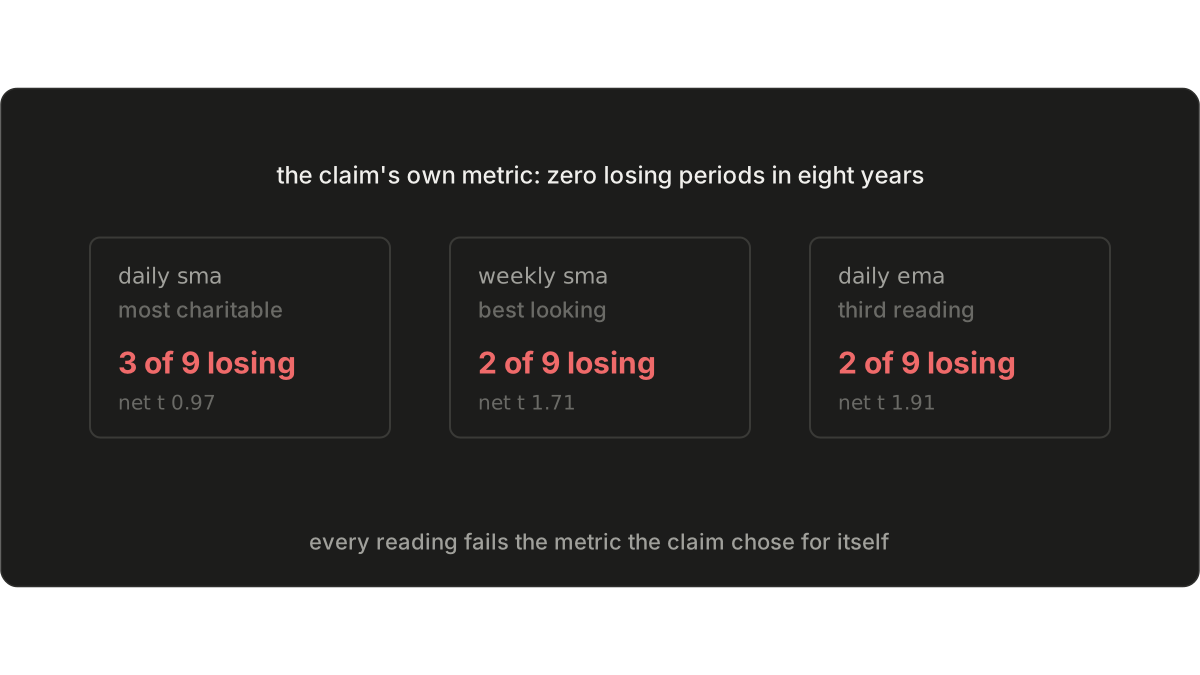
The claim, tested on its own metric#
The claim's success criterion is built in: no losing period in eight years. Here is what the harness measured on SPY through 2026, net of costs.
| Interpretation | Charitable | Losing periods (of 9) | Net Sharpe | Net t-stat | Max drawdown | Claim holds |
|---|---|---|---|---|---|---|
| Daily SMA | yes | 3 | 0.34 | 0.97 | 27.8% | no |
| Weekly SMA | no | 2 | 1.33 | 1.71 | 28.4% | no |
| Daily EMA | no | 2 | 0.68 | 1.91 | 20.4% | no |
Every reading fails. The most charitable one fails hardest, with three losing years out of nine. The best-looking reading, weekly SMA, still had two losing periods and a net t-statistic of 1.71, which is not significance, and the probability-of-backtest-overfitting check across the nine declared variants comes in at 0.25. Nothing here says crossover systems are worthless. What the numbers say is narrower and more useful: this specific claim, tested on the metric it chose for itself, is false under every reasonable reading.
The boundaries, stated plainly: one instrument, inferred definitions, fixed windows, 2008 periods of daily data. If the original poster ever publishes the exact rules, the harness can run those instead, and I would welcome it. Testing the strongest available version is the standard this series holds itself to, and it cuts both ways.
The receipts: claim 001-five-ten, strategy ma_cross over SPY, content
hash 8ffb311b...6f9cc, recorded alongside the autopsy runner in the
platform's evaluation suite. The recorded config reproduces this table, and
the hash pins which config that was.
This is historical analysis of a public claim, not investment advice, and not a forward claim about any strategy or market. Nothing here recommends trading anything.
The viral format wins by never being checkable. The counter is not louder confidence. It is a definition, a window, a cost assumption, and a hash, so that the next person does not have to trust either of us.
Questions this post answers
- What is the 5/10 strategy?
- As claimed in the viral post: a moving-average crossover using a 5-period and a 10-period average, presented as not having had a losing period in eight years. The source video is gone, so the instrument, average type, and bar interval had to be inferred; the test logs each inference as its own interpretation.
- Did the 5/10 strategy really never lose?
- No, not under any tested reading. The most charitable interpretation (daily SMA on SPY) had 3 losing years out of 9. The other two readings each had 2. The claim's own metric is zero losing periods, so every interpretation fails it.