How do you tell when the yield curve has inverted?
The yield curve surface labels the real curve inverted when the 30-year Treasury yield is more than 0.1 percentage points below the 1-month yield; on the 2026-09-22 curve the 30-year was 5.29 percent and the 1-month 3.97, so the read was upward. The same rule labels the curve upward above plus 0.1 points and flat in between, and it is applied to every day in the file.
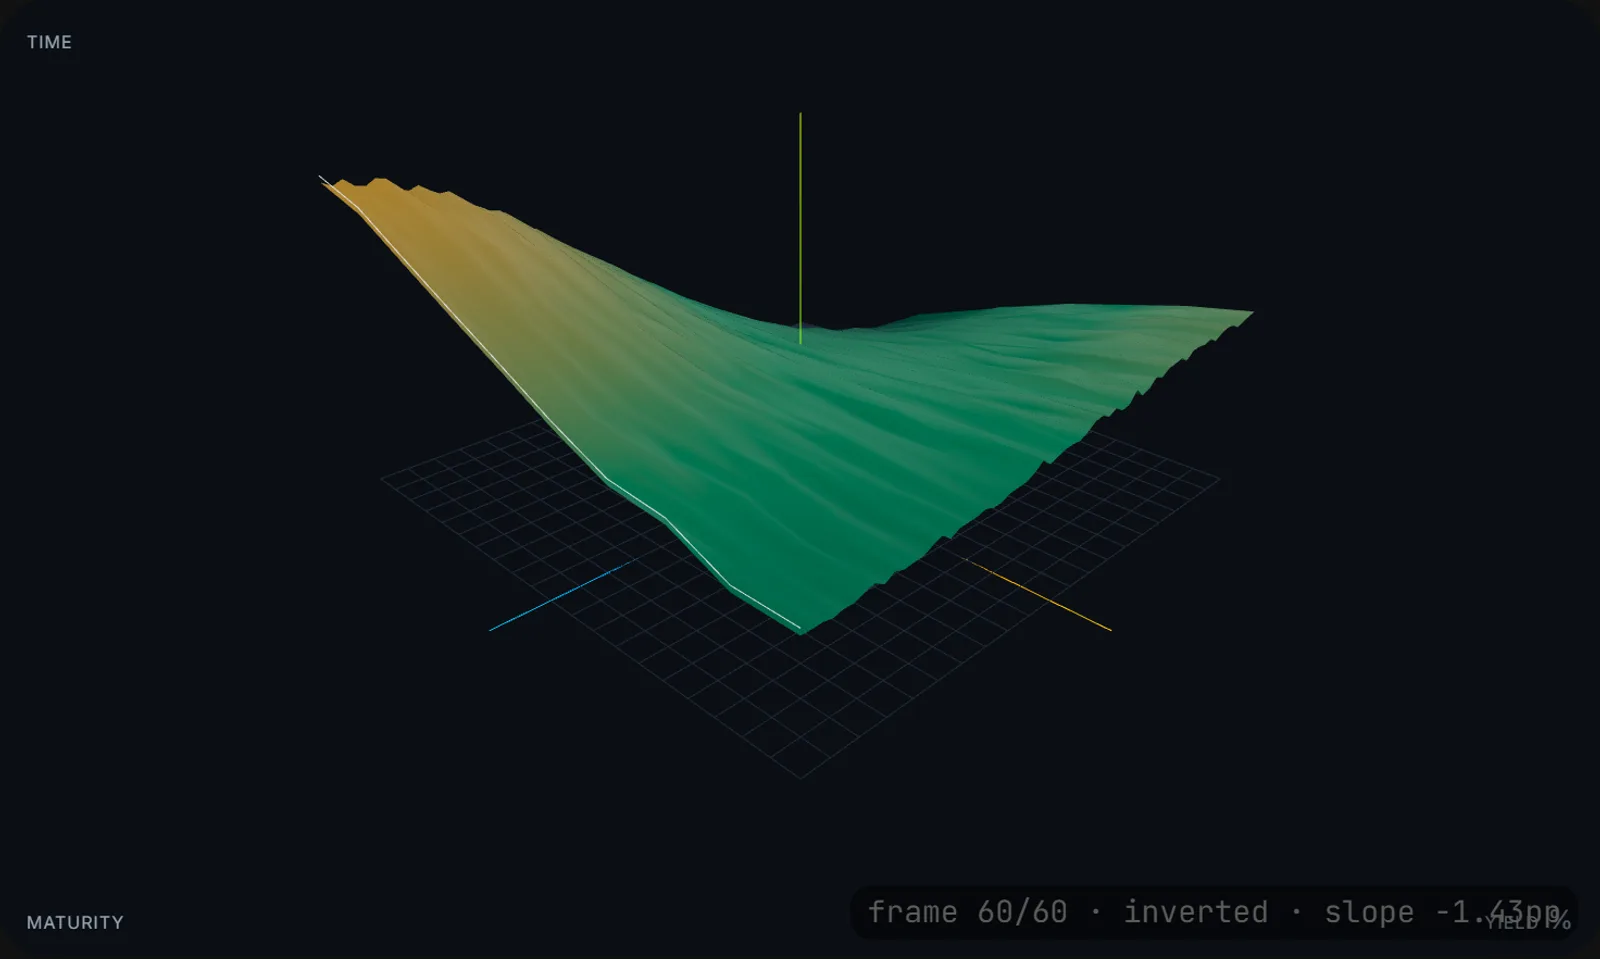 Textbook mode, not the live curve: a synthetic Nelson-Siegel inversion. The real 2026-09-22 curve read upward.
The badge tests only the two endpoints#
A yield curve is the interest rate for lending to the Treasury over different lengths of time, drawn as a line from the shortest maturity to the longest. Normally it slopes up, because longer loans cost more. An inversion is the line tipping the other way, with short rates above long rates, and it is the shape everyone calls a recession warning. The surface draws that line for every day in its window and stacks the days along a second axis, so the curve becomes a sheet you can scrub through time and watch tilt.
The label on the page comes from one subtraction. The tool takes the last yield in the curve minus the first, which on the real data is the 30-year minus the 1-month, and thresholds it at a tenth of a point either side of zero. Above plus 0.1 the badge says upward; below minus 0.1 it says inverted; in between it says flat. A separate chip reports the day-over-day move in the 2s10s spread, the 10-year minus the 2-year, and a spread clock panel below the surface draws that pair over the same sixty sessions and over its full history.
Publish only dates with all eleven yields#
The real curve is eleven FRED constant-maturity series: 1-month, 3-month, 6-month, 1-year, 2-year, 3-year, 5-year, 7-year, 10-year, 20-year and 30-year. A scheduled job runs daily, requests the 120 newest observations for each series, joins them on date, and keeps only the dates where all eleven have a value, oldest first. It publishes the 60 most recent complete curves as one file and refuses to publish at all if fewer than 5 survive the join, so a partial fetch cannot replace a good file with a thin one. The page reads that file; the browser never calls FRED.
On the file I read while writing this, the 60 curves ran from 2026-06-29 to 2026-09-22. The latest one, in percent from short to long, was 3.97, 4.16, 4.26, 4.43, 4.71, 4.81, 4.83, 4.89, 4.96, 5.33 and 5.29. The 2-year at 4.71 and the 10-year at 4.96 put the 2s10s spread at plus 0.25 points, against plus 0.28 on the first day of the window. The 20-year at 5.33 sat above the 30-year at 5.29, a small kink at the long end that a badge computed from the endpoints alone will never mention.
Sixty sessions is the surface's window, not the page's#
Sixty complete sessions is about three months, so the sheet and its badge can show the curve steepening or flattening within a quarter and nothing older. Below the surface, the spread clock panel draws the 2s10s spread's daily history back to 1976 from a separate baked series, with recession months shaded, and that panel is where to look for when the spread last went negative. The page shades recessions but computes no lead time from inversion to downturn and no hit rate, because the tool draws yields and does not forecast from them.
The label is a rule about two endpoints, so a curve that is inverted in the middle and upward at the ends reads as upward. And the real and synthetic modes use different maturity grids, eleven points from one month on the real data and ten points from three months on the textbook curve, so a number read off one mode should not be quoted against the other.
The textbook mode inverts on purpose#
When the real curve is not inverted, which it was not on 2026-09-22, the page still needs to show what an inversion looks like forming. The synthetic mode does that with the Nelson-Siegel three-factor formula: a level, a slope factor, a curvature factor, and a decay constant. Six named presets set those four numbers for normal, flat, inverted, steepening, bear-flattening and level-shift shapes, and a transition interpolates from one preset to another over 24 to 90 frames with up to 15 basis points of seeded jitter so the sheet does not look machined. Going from the normal preset to the inverted one moves the slope factor from minus 1.6 to plus 1.6, the level from 4.0 to 3.4, and the curvature from 0 to minus 0.4, with the decay constant held at 2.0.
The deep link in the post that built the five surfaces opens the synthetic mode on its last frame, fully inverted, and the badge says so. The real mode opens on the newest curve in the published file, and the tool's rule applied to the 2026-09-22 curve gives upward. Both are labeled, and the label is the first line to read before the shape.
Related:
- Rendering an options Greeks surface in 3D in the browser, how this surface and the other four were built on one math-to-mesh boundary
- How do you read a 3D option Greeks surface?, the companion page for the options surface
Questions this post answers
- What counts as an inverted yield curve?
- Short-term Treasury yields above long-term ones. The yield curve surface uses one rule: the 30-year yield minus the 1-month yield. Below minus 0.1 percentage points the curve is labeled inverted, above plus 0.1 it is labeled upward, and between the two it is flat. The 2s10s spread, the 10-year minus the 2-year, is the other common definition; the tool shows that spread's day-over-day move and its history in a panel below the surface.
- Where does the yield curve data on the page come from?
- Eleven FRED constant-maturity Treasury series, DGS1MO through DGS30, pulled by a daily scheduled job that requests the 120 newest observations per series, keeps only dates where all eleven have a value, and publishes the 60 most recent complete curves. If fewer than 5 complete curves survive, nothing is published and the page keeps the previous file.
- Is the yield curve inverted right now?
- As of the 2026-09-22 curve in the published file, no. The 1-month yield was 3.97 percent, the 10-year 4.96, the 30-year 5.29, and the 2-year 4.71, so both the long-minus-short slope and the 2s10s spread were positive. The page updates daily; this answer is a dated snapshot.
- What is the textbook mode on the yield curve page?
- A synthetic curve built from the Nelson-Siegel three-factor formula, animated from one of six named regime presets to another over 24 to 90 frames with up to 15 basis points of seeded jitter. Going from the normal preset to the inverted one moves the slope factor from minus 1.6 to plus 1.6, the level from 4.0 to 3.4, and the curvature from 0 to minus 0.4. It exists so an inversion can be watched forming even when the real curve is not inverted, and the page labels it synthetic.
Keep reading
Rendering an options Greeks surface in 3D in the browser
A 3D render crossed my feed once and stuck with me, so I tried to see an option the same way: as a surface I could grab and turn, not a number. That turned into five market visualizations on one shared trick, a compliance rule the architecture enforces by accident, and an honest lesson about wanting a crystal ball and getting understanding instead.
How do you read a 3D option Greeks surface?
The Greeks manifold prices a long call on a 60 by 60 Black-Scholes grid over spot and time to expiry, draws profit and loss as height against a premium fixed at the strike and the longest tenor, and colors each cell by one Greek. Gamma is a ridge near the strike that sharpens toward expiry, theta is the downhill slope toward expiry, delta is the slope along price, and vega and rho recolor the sheet while moving the benchmark it is measured against. Ticker mode positions the same surface on a published S&P 500 name.
Market's Best
The top-graded stocks from the latest market scan. No sign-in needed.
More games
Browse the rest of the games.
Grade my portfolio
Run a sample portfolio through the investor committee.
Factor-First AI Investment Platform Narrated by a Six-Persona Committee
Grew a single-ticker grader into a full investment platform: a four-factor composite (Quality, Valuation, Momentum, Health) narrated by a six-persona committee, a nightly scan of several hundred large caps, portfolio and net-worth tracking, and daily measurement of historical ranking behavior.
Follow the work
New tools and writing as they ship — pick a channel.