Caskey Engineering

← Back to Blog

Architecting caskeycoding.com: four stacks, one table, two agents, one harness

Most of the blog so far has been about the methodology — specs, context, the workflow that lets a stateless agent ship production code. This post is the other side. What actually runs when you load a page on this site. The CDK stacks, the data model, the agent orchestration. Decisions, not features.

The architecture is small on purpose. Four stacks, one DynamoDB table, two Lambdas in the agent path, one S3 bucket for content offload. Every boundary in it earns its place.

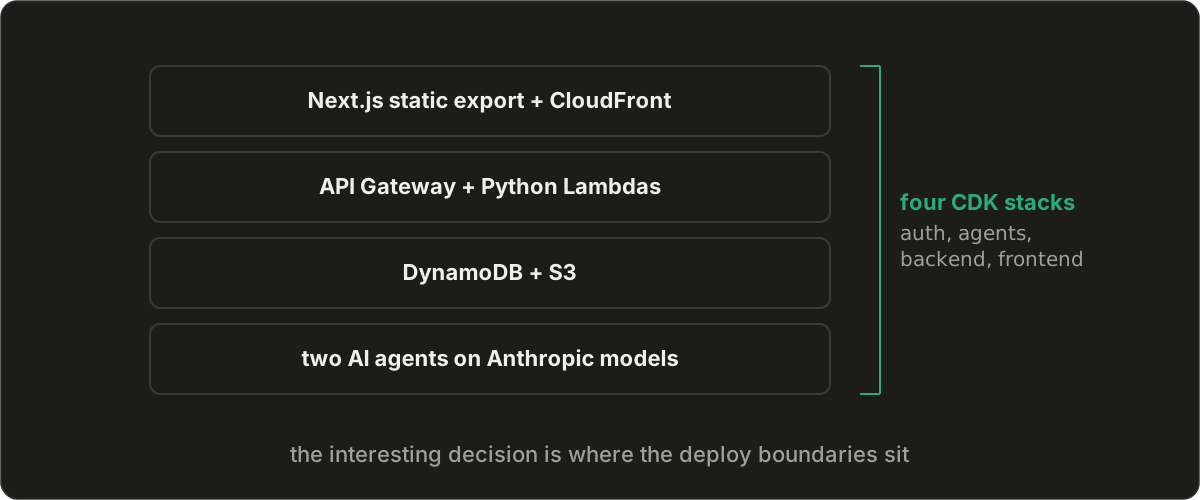
Four stacks, in dependency order

The infrastructure splits across four CDK stacks. The split is not by team or by service, it is by blast radius and deploy cadence.

AuthStack owns the Cognito user pool. It almost never changes. When it does, every other stack is affected, so it sits at the root of the dependency graph and is deployed first.

AgentStack owns the two Bedrock-permissioned Lambdas. It changes often — prompt tweaks, model swaps, new agents — but those changes are independent of the API surface. Putting the orchestrator in its own stack means a prompt change does not redeploy the API Gateway, and a Bedrock IAM change does not touch the data layer.

BackendStack owns the API Gateway, the blog handler Lambda, the DynamoDB table, and the S3 content bucket. It receives the Cognito user pool and the agent Lambda as cross-stack references. This is the only stack with the API contract — when the contract changes, this stack moves, and the frontend follows.

FrontendStack owns the static site infrastructure — S3 bucket, CloudFront distribution, Route53 records, ACM certificate. It is at the bottom of the chain because it is the only one that the public can see and break against. A FrontendStack deploy never touches the API or the data.

The benefit of the split is that a 30-second prompt change in AgentStack does not put the API at risk. A DNS or CloudFront change in FrontendStack does not redeploy a Lambda. Each stack has its own change cadence, its own failure mode, its own rollback. The principle is older than CDK and it is the one I would defend hardest if asked to collapse them into one stack for simplicity.

The edge: Route53, CloudFront, WAF

The site has two request paths — static and dynamic — and the edge is shaped differently for each.

Route53. One hosted zone holds the apex and www A-records (aliased to CloudFront), the Google Workspace MX records, an SPF TXT, and a DMARC TXT at p=quarantine. DNS is not just for routing here — it is also the contract that mail from this domain can be trusted. SPF and DMARC live in the same stack as the routing records on purpose. If the zone moves, the deliverability story moves with it.

CloudFront, static path. The distribution fronts a private S3 bucket via origin access. Viewer protocol policy is REDIRECT_TO_HTTPS. The interesting part is the viewer-request CloudFront Function attached to the default behavior. It does two jobs:

  1. Rewrites extensionless URIs (/blog, /tools, /finance/net-worth) to their .html keys so a hard reload of a Next.js static-export route hits the right S3 object instead of falling through to 403.
  2. Issues a 301 for one retired blog slug whose value-framework framing no longer matches the current scoring model.

CloudFront Functions, not Lambda@Edge. The job is string-mangling on every viewer request, hot-path code where a millisecond of cold start is the whole budget. CloudFront Functions run in microseconds at the edge, no cold start, no VPC, no Node runtime. Lambda@Edge is the right tool when you need npm packages or AWS SDK calls in the request path. This is neither.

Two errorResponses map 403 and 404 to /index.html. That is the safety net for client-routed pages where the static export has not pre-rendered a matching .html, and it is also what catches an S3 403 on a missing key without leaking the underlying error to a reader. There is a tight coupling here between Next.js trailingSlash and the CloudFront rewrite function — flip one and the other has to move in lockstep, or every sub-route 404s and the errorResponses fallback silently serves the homepage in their place. That failure mode is loud once you see it and silent until you do, which is why it lives in the operational-lessons file rather than only in code comments.

A CloudWatch alarm sits on AWS/CloudFront 5xxErrorRate for the distribution at >5% over three 5-minute windows, two breaching. It pages an SNS topic. The static path is supposed to be boring. If it stops being boring, I want to know.

WAF, dynamic path. The dynamic side runs through API Gateway. The interesting hardening lives on the /public/* routes — the unauthenticated demo endpoints that surface AI features to anyone who lands on the site. Those routes are gated by a wafv2.CfnWebACL with four per-route rate-based rules, one per public POST endpoint, each at 100 requests per 5-minute window per source IP.

A few choices worth naming.

Scope is REGIONAL, not CLOUDFRONT. The WebACL associates with the API Gateway stage directly because CloudFront does not currently front the /public/* routes — the static site and the dynamic API are different distributions in this design. A future PR fronts a subset of /public/* through CloudFront for edge caching; that ACL will be a separate CLOUDFRONT-scoped resource. Same WAF, different scope, different attachment point.

Per-route rules, not one global rule. The four rules are functionally identical right now — same limit, same window. Splitting them keeps the CloudWatch metric dimensions clean, so a single-route abuse pattern is one chart, not a guess.

WAF is not the rate limiter. AWS WAF's rate-rule minimum is 100 requests per 5-minute window. That is two orders of magnitude looser than the per-IP daily quotas the demo system actually enforces. The fine-grained limiter lives in the handler against a DynamoDB session row. WAF exists to shut down pathological abuse — thousands of requests per minute from one IP — before any Lambda ever gets warm. Two layers, two jobs. The application limiter protects cost. WAF protects the application limiter.

The Cognito-gated routes (/blog, /agent) do not have WAF rules. They have auth, which is a stronger filter than a rate rule. WAF goes where there is no auth, and that is the rule the topology is built around.

One table, two item types

The data model is a single DynamoDB table. Partition key is postId, sort key is type. Two item types live in it: post and agent_task. That is the entire schema.

The temptation in a system with two clear nouns is to give them two tables. I did not. The cost of a second table is provisioning, two IAM policies, two backup configurations, two monitoring dashboards, and one more decision the next person who touches the system has to understand. The benefit is a slightly cleaner mental model. For this scale, the benefit does not pay for the cost.

Single-table design earns its keep when you have stable access patterns and you can reason about them before you commit. The patterns here are narrow: read a post by id or slug, write an agent task, update a task as it moves through the orchestrator, list recent posts. None of these need a GSI for this scale, and adding one before it is necessary is the kind of premature decision that ages badly.

S3 offload at 2KB

Blog content under 2048 bytes lives inline in the DynamoDB content field. Content at or over 2KB lives in S3 at posts/{postId}.md, and DynamoDB stores only the contentKey. On read, the handler transparently pulls from S3 and strips contentKey from the response. The frontend never sees the boundary.

Two reasons for the offload, in order of importance.

DynamoDB item size limits. The hard limit is 400KB. Long-form essays approach that quickly once you add tags, metadata, and revisions. The fix is well-known and the failure mode without it is loud — writes start rejecting, and you find out at the worst possible moment.

Per-read cost. DynamoDB charges by item size on every read. S3 is far cheaper for the bytes that make up most of a blog post. The 2KB threshold is where the round-trip cost to S3 starts to be worth it. Below that, the extra GET is wasted; above that, the read capacity savings dominate.

The threshold is a tuning knob, not a fundamental choice. The architecture allows either side to grow without changing the contract. That is the test of a good boundary.

Two agents, not five

The orchestrator coordinates a two-step workflow: generate, then polish. The earlier design had five agents — generate, revise, fact-check, SEO, schedule — each calling Bedrock separately. The new design folds revision, fact-checking, and SEO into a single polish call.

The five-agent pipeline existed because earlier Claude models were not strong enough to do all four jobs in one prompt. The output drifted. The fact-checker missed claims the SEO agent then optimized for. Splitting was the right call at the time.

It is no longer the right call. Claude 3.5 Sonnet handles revision, fact-checking, and SEO in one well-prompted call without losing accuracy, and it does so for a fraction of the latency and a fraction of the cost. Four Bedrock invocations collapsed into two. The orchestrator became a thirty-line function instead of a state machine.

The lesson is not "fewer agents is better." The lesson is that agent count is a function of model capability, and that function changes underneath you. Re-evaluate the boundaries every time the model improves. A pipeline that was correctly sized eighteen months ago may now be over-engineered. Treat the agent topology as a tuning parameter, not a permanent design.

The AI harness: one client, every call

Every Anthropic call from every agent in the backend goes through one file: src/shared/llm/anthropic_client.py, function invoke_with_retry. That is the harness. The agents above it choose prompts and parse outputs. The client below it owns retries, fallbacks, logging, secrets, and cost. The boundary is deliberate — agents stay small and readable, and the discipline lives in one place where it can be reviewed, alarmed, and changed without touching the prompts.

A few things the harness does that are worth naming.

Direct API to api.anthropic.com, exclusively. Model calls go through the official anthropic Python SDK, not through Bedrock. The decision is binding across the org (ADR-008). The reason is not religious: Bedrock historically lagged on model availability, on prompt-caching support, and on streaming features that the application surface relies on. Calling the source means new model versions are available the day they ship, and the cost story is one provider's table instead of two. Bedrock is in the codebase, but only as a fallback for outages, never as the primary path.

Models chosen by role, not by default. Three model IDs live in the harness:

  • Workhorse: Claude Sonnet 4.6 (claude-sonnet-4-6) — tool loops, generation, the polish agent.
  • Synthesis: Claude Opus 4.7 (claude-opus-4-7) — multi-source reasoning, used sparingly because the cost-per-token is the highest in the family.
  • Routing / classification / eval judge: Claude Haiku 4.5 (claude-haiku-4-5-20251001) — short, cheap, fast.

Picking a model is a decision, not a default. The polish agent uses Sonnet. A future routing agent that decides which deeper agent to invoke would use Haiku. A future cross-spec synthesis agent would use Opus. Each model has a job. Letting one model do every job is the same failure mode as one stack doing every job — it works until the cost or latency profile shifts and you cannot tell which call is the culprit.

Retry, then Bedrock fallback, then alert. The flow on a model call is: try Anthropic up to three times with exponential backoff, and if every retry fails, send a Discord webhook to me with the error category and route the same call through Bedrock under a per-model cross-region inference profile. If Bedrock also fails, raise the original Anthropic error so the upstream handler can return a real status code, not a fake success. Two providers, one fallback edge, one human-in-the-loop alert.

The fallback exists because Anthropic outages and rate-limit hits are the failure mode I have actually seen, not a hypothetical. The Discord alert exists because a silent fallback is worse than a noisy one — Bedrock has slightly different model versions and slightly different latencies, and I want to know I am running on the fallback path before the next deploy.

Lazy imports for the heavy SDKs. anthropic and boto3 are imported inside the function that uses them, not at module level. The reason is concrete: CI test jobs in this repo do not install the full Lambda dependency set, and a module-level import anthropic breaks test collection for every handler that transitively touches the client. This is in the operational lessons file as a hard rule, and the harness encodes it once so no agent has to remember.

Secrets are not in environment variables. The API key resolves in this order: ANTHROPIC_API_KEY env var, then Secrets Manager under a configurable secret name. In production the env var is never set; the Lambda's execution role reads the secret on cold start and caches it in os.environ for warm-invocation reuse. Rotation is one Secrets Manager edit. No code deploy, no env var rewrite, no leaked key in CloudFormation parameters.

Structured llm_call logs in non-prod, hashed-only in prod. When EVAL_LOG_LLM_CALLS=1, every call emits a single-line JSON record to CloudWatch with model, agent label, latency, token usage, fallback flag, and an error category. The full system prompt, user payload, and completion text are emitted only when ENVIRONMENT=non-prod — production logs carry the metadata and a prompt_sha256 hash but never the payload. The env gate defaults to prod so an unset Lambda env never leaks prompts. That is the kind of default that costs nothing to get right at design time and is expensive to retrofit after a breach.

Pricing in code, refreshed on a calendar. src/shared/llm/pricing.py is the one place in the codebase that holds per-model dollar-per-token tables. It carries a _verified_at ISO date and a link to the Anthropic pricing page, and a CI check fails the build if the date is older than 90 days. Public demo handlers call usd_for_usage(model, **response.usage.model_dump()) after every Anthropic invocation and add the cost to a DynamoDB-backed per-IP-per-day budget row. The harness reads cost. The handlers enforce ceilings. The CI calendar keeps the numbers from drifting silently against the provider's price changes.

The eval and replay harness

The harness above governs every model call in production. The eval harness governs whether those calls are still producing the outputs they were producing yesterday.

Five Anthropic-calling code paths in the backend feed the same shared client: the coach narrative, the committee narrator, the finance chat, the content-generation agent, and the content-polish agent. All five have strong deterministic test coverage on the rule engines and validators that surround them. None of them used to have a test on the LLM output itself. Every prompt edit, every model bump, every persona-roster change shipped on vibes and was observed only when someone noticed the tone had drifted.

The replay harness is the fix. Cases are YAML files at eval/<agent>/cases/<case-id>.yaml. Each one captures an input shape, an expected verdict band, and — for cached cases — a sibling .completion.txt fixture of the model's prior output. The harness runs in three modes:

  • --cached (default): replays against the captured completion. No API call, no cost, no flakiness. Used in CI on every PR.
  • --live with EVAL_LIVE_EXECUTE unset: dry-run that builds the full request payload and asserts it contains the expected fields. The model is never invoked. Used to validate that a prompt edit still produces a structurally-correct request.
  • --live with EVAL_LIVE_EXECUTE=1: fires the API and records the new completion as a candidate fixture for review. Used manually, not in CI.

A pytest entry point (eval/test_replay.py) parametrizes one test per YAML case so the cases ride the same pytest invocation as the rest of the suite. New cases come from the structured llm_call logs above: turn on EVAL_LOG_LLM_CALLS=1 in non-prod, exercise the agent against real inputs, and the captured prompt-and-completion pair becomes the next seed case. The observability layer feeds the eval layer feeds the regression net.

The design choice worth naming: the eval harness is not a benchmark. It is a regression net. The cases are the outputs I trust today, and the test is whether tomorrow's prompt edit still produces them. Benchmarks ask whether the model is good. The replay harness asks whether anything moved.

The async boundary in the agent path

There are two Lambdas in the agent stack, not one. The API handler is lightweight, thirty-second timeout. The orchestrator is the long-running one, five-minute timeout for the full Bedrock workflow.

The split is the response to a single fact about API Gateway: the integration timeout is twenty-nine seconds, and any single Bedrock call can blow past that. The API handler stores the task in DynamoDB with status IN_PROGRESS, invokes the orchestrator asynchronously via lambda:InvokeFunction, and returns the task id immediately. The orchestrator runs the workflow and updates the same row through PENDING_REVIEW, COMPLETED, APPROVED, or FAILED.

The frontend polls /agent/status/{taskId} for the result. Two Lambdas, one row in DynamoDB, one async boundary. The user sees a non-blocking generate call. The orchestrator gets the headroom it needs. Neither side carries complexity that belongs to the other.

What the architecture is not

It does not have a queue. Async work goes through Lambda-to-Lambda invocation, not SQS. At this scale a queue would be ceremony.

It does not have a separate cache tier. The blog reads from DynamoDB directly and S3 transparently. CloudFront caches the static site, and a single /public/now API path is fronted by a 15-minute CloudFront cache behavior for the demo endpoint that justifies it. There is no Redis tier and there will not be one until a read pattern justifies it.

It does not have a microservice per noun. There is one Python service, one repo, one deploy. The split that matters is by deploy cadence and blast radius, captured in the CDK stack split. Internal module boundaries are markdown and import discipline, not network calls.

Each of those is a place where the system could grow if the patterns demanded it. None of them does today. Building for a load profile the system will not see for two years is how complexity accumulates without a corresponding capability.

What the architecture is for

Every decision above is in service of the same property: I can change one part of the system without redeploying the rest. A prompt change deploys in seconds. A DNS change does not touch a Lambda. A schema change does not invalidate the static site cache. A model swap does not redeploy the API. A failing eval case fails CI without firing the API.

The AI harness is the same idea pushed inward. Agents own prompts. The client owns retries, fallbacks, secrets, logging, and cost. The eval harness owns regression. Each layer has a job and a boundary. None of them carries complexity that belongs to another.

That is what platform engineering is. Not a technology choice. A discipline of boundaries that hold under change.

The specs that drive this site are public, and the architecture specs for the system above are in the specs demo repo. If you want to see the same decisions before they hit code, that is the right place to start.