What Newey-West does to a backtest t-statistic: 18 months became two
A Newey-West standard error is the ordinary standard error of a mean, inflated to account for the autocorrelation in the series behind it. On my engine's 12-month panel it turned 18 monthly readings with a t-statistic of negative 18.8 into about two independent observations, and a number that looked like the most decisive result the engine had ever produced into no result at all.
The reading came out of the diagnostic harness I wrote for my factor scoring engine. The harness scores a universe of stocks at each month-end, waits for the forward return over some horizon, and computes a cross-sectional information coefficient per date: the rank correlation between score and what happened next. Average the per-date ICs, divide by the standard error of that average, and you have a t-statistic. The 12-month quality reading came back at negative 0.57 across 18 dates with an unadjusted t of negative 18.8. A quality factor that predicts returns backward is a factor built wrong, and that is the fault I went looking for first.
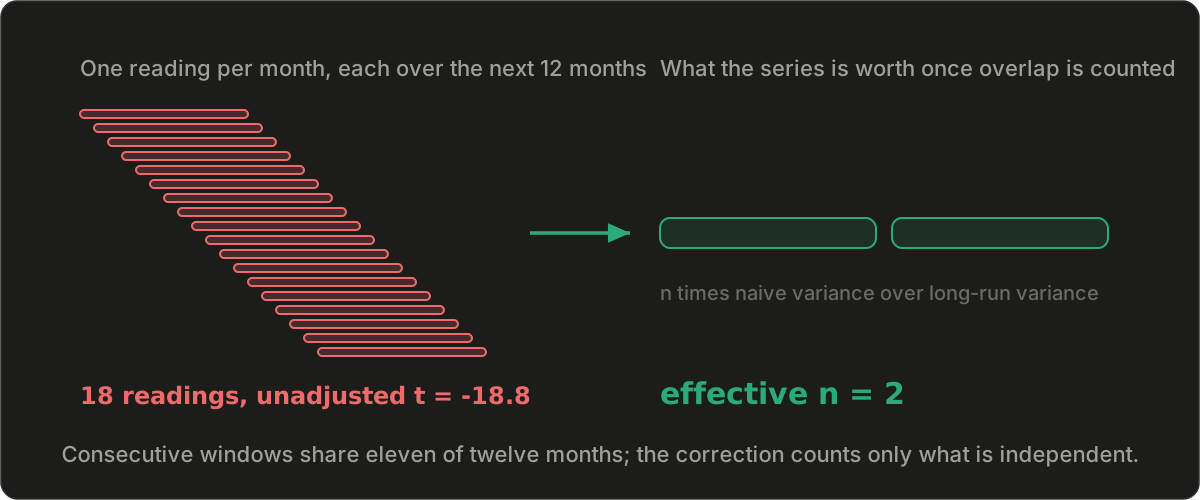
Why 18 readings are not 18 facts#
The naive standard error is the standard deviation of the per-date ICs, 0.13 here, divided by the square root of 18. That formula assumes the readings are independent draws. On a 12-month horizon they cannot be. The forward-return window starting in January covers February through December; the window starting in February covers eleven of those same months. Two consecutive readings share 92 percent of their evidence. The scores are sticky as well, since a company's quality metrics do not reshuffle month to month, and whether a factor is working tends to run in regimes that last quarters, not weeks.
All three effects push the same direction. The per-date ICs move together, so their average is far less certain than 18 independent draws would make it, and the naive formula understates the standard error by the amount of that shared movement. The t-statistic inherits the understatement in its denominator and comes out too large. With 92 percent overlap it comes out absurdly large, which is how a rank correlation on a few dozen stocks acquired a t-statistic larger than any I have seen reported for a factor.
The Newey and West (1987) correction replaces the sample variance with a long-run variance. Take the variance of the series, then add twice the autocovariance at lag one, lag two, up to lag L, each weighted by a Bartlett factor of one minus the lag over L plus 1, so nearby lags count fully and distant ones fade out. The helper in my harness is fourteen lines: the mean, the deviations, the lag-zero variance, a loop that accumulates weighted autocovariances into the long-run variance, then the mean divided by the square root of that variance over n.
The ratio of the two variances has a name I now print on every cell: effective n, which is n times the naive variance over the long-run variance, capped at n. For the 12-month panel it came out at about two. An IC standard deviation of 0.13 is already below the sampling-noise floor for a Spearman correlation on eight observations, and the series was worth two. A t-statistic with one degree of freedom is not a small t-statistic; it is a number the t-distribution declines to interpret. The reading was not evidence of an inverted factor. It was two data points wearing a t-statistic, and the composition of the panel, a self-selected set of tickers scored across two engine versions, accounts for the sign.
The lag is a decision, not a default#
Nothing in the formula tells you L. Too small and the correction misses the overlap; too large and the estimate of the long-run variance gets noisy in its own right. The engine's comparator derives L from the horizon: the number of series steps two snapshot dates can be apart and still share a forward window, which is the horizon divided by the median spacing between dates, rounded up, minus one. On month-end dates that is lag 11 for a 12-month horizon and lag 2 for a 3-month one, clamped to n minus 1. When it does not know the horizon it falls back to the automatic Bartlett rule, the floor of 4 times n over 100 to the two-ninths power. A Bartlett estimator truncated at L ignores every lag above L, so a lag chosen without looking at the horizon is a lag that can miss the overlap entirely.
My standalone diagnostic scripts take the other route for a different series: the monthly net-of-cost portfolio returns get a fixed lag 3 as a quarterly overlap guard, because the scores refresh on quarterly filings, while the IC series defer to the comparator's horizon rule. The textbook rule of 0.75 times T to the one-third power gives lag 3 at around 64 monthly observations and lag 1 on the 18-date panel, which is one more reason the horizon-derived lag is the one that decides. When two conventions disagree I take the larger. An overstated standard error costs me a true signal I will find again with more data. An understated one costs me a weight change in a live engine.
I told this story with the wrong numbers once#
My June post on backtesting without fooling yourself told a version of it with a different pair: a factor whose naive t was negative four and whose Newey-West t was negative 1.6. The mechanism in that paragraph is right and I would write it the same way again. The numbers came from a point-in-time scoring harness that I later found had two defects, a market-cap field that leaked today's value into historical dates and a renamed API field that left one factor reading a constant. Every negative quality reading that harness produced is void, including the one I quoted. The correction ratio was real; the signal it was correcting was an artifact. I would rather say so here than let the older paragraph stand as the reference.
The clean re-measurement, on a point-in-time mid-cap corpus with the leaks fixed, put the same factor's 6-month IC at plus 0.046 with a Newey-West t of plus 3.5 over 2015 to 2021. Three caveats travel with that number in every record the engine writes. It is an upper bound, because the corpus has no in-window delistings. It is an information coefficient, not a net-of-cost portfolio return, and the engine has not shown that any factor survives transaction costs, which is the bar that decides anything. And in the 2024 to 2025 sub-window, the one with the least survivorship contamination, the same factor's 6-month IC is plus 0.008 with a Newey-West t of plus 0.39, indistinguishable from zero. Two readings compete, and both are open.
The gate that makes the correction unskippable#
A correction you remember to apply is a correction you will forget under deadline. After the 12-month episode I moved the effective-n calculation from a diagnostic printout into the engine's decision protocol. Every IC and t-statistic the engine records now carries an effective-n field. No factor weight is promoted unless the holdout cell that validated it has an effective n of at least 8 at the headline horizon, and none of the revision triggers, the checks that can propose a change to how a factor is scored, fires unless every horizon it names clears the same floor. Below the floor the cell reports itself as immature and not actionable, the same state the engine uses for a signal with no forward record at all. The floor of 8 is provisional and I expect to move it. The rule that a cell below the floor cannot change a weight is not.
The 12-month cell is still immature. With monthly scoring and a one-year horizon it gains roughly one independent observation per year, so it will sit in the dark state for most of a decade while the 1-month and 3-month cells, which gain one every month or every quarter, do the work of validating weights. Choosing a horizon is choosing how long you are willing to wait before you are allowed to believe anything.
Questions this post answers
- What is a Newey-West standard error?
- The standard error of a mean, inflated for autocorrelation in the series. Instead of the sample variance alone, it uses the long-run variance: the variance plus twice the weighted sum of the autocovariances at lags one through L, with Bartlett weights of one minus k over L plus 1. Divide the mean by that standard error and you have the Newey-West t-statistic.
- When do you need Newey-West in a backtest?
- Whenever consecutive measurements share information. A 12-month forward return measured every month overlaps its neighbor in 11 of 12 months, so 18 monthly readings are nowhere near 18 independent facts. On my engine's 12-month panel the unadjusted t-statistic was negative 18.8 and the effective number of independent observations was about two. Overlapping windows, sticky scores, and regime persistence all call for the correction.
- How do you choose the Newey-West lag?
- From the horizon. My engine derives the lag as the number of series steps two snapshot dates can be apart and still share a forward window: the horizon divided by the median spacing, rounded up, minus one. On monthly dates a 12-month horizon gets lag 11 and a 3-month horizon gets lag 2. When the horizon is unknown it falls back to the automatic Bartlett rule, the floor of 4 times n over 100 to the two-ninths power. When two conventions disagree, the larger lag is the conservative error.
- What is effective sample size in a backtest?
- The number of independent observations the series is worth: n times the naive variance divided by the Newey-West long-run variance, capped at n. My engine refuses to promote any factor weight unless the holdout cell that validated it has an effective n of at least 8.
Keep reading
How to backtest without fooling yourself
A backtest's job is not to find an edge. It is to stop you from believing in one that is not there. The toolkit I used to test my own trading engine, and the part where it killed my single best signal.
Backtesting the 5/10 crossover strategy that never lost
A viral post claimed a simple 5/10 moving-average strategy that has not lost in eight years. I codified the most charitable readings of the claim, ran each one over SPY with costs, and checked the claim against its own success metric. It fails under every interpretation, and the receipts are hashed.
Does the order block pattern predict price? A backtest of the claim
The order block is trading social media's favorite glossary card. I wrote the definition down as code, ran it across 30 large-cap names and five years of daily bars, and measured what the retest entry actually earns net of costs. The verdict, the exact rule, and the artifact hash are all here.
Market's Best
The top-graded stocks from the latest market scan. No sign-in needed.
Grade my portfolio
Run a sample portfolio through the investor committee.
Factor-First AI Investment Platform Narrated by a Six-Persona Committee
Grew a single-ticker grader into a full investment platform: a four-factor composite (Quality, Valuation, Momentum, Health) narrated by a six-persona committee, a nightly scan of several hundred large caps, portfolio and net-worth tracking, and daily measurement of historical ranking behavior.
Follow the work
New tools and writing as they ship — pick a channel.